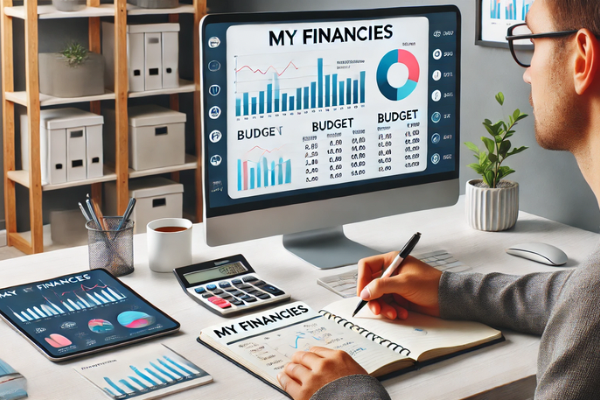
Managing your money effectively starts with having a clear view of your financial picture. A financial dashboard is a powerful tool that allows you to track key financial metrics in one place—giving you clarity, control, and confidence in your decisions.
You don’t need fancy software or a finance degree to build a dashboard. With a bit of organization and consistency, you can create a simple and effective system to monitor your income, expenses, savings, debt, and goals.
This article will walk you through how to build a straightforward financial dashboard that helps you stay on top of your money and make informed financial choices.
What Is a Financial Dashboard?
A financial dashboard is a visual representation of your most important financial data. Think of it as a snapshot of your entire financial life, updated regularly, that shows where you stand and where you’re headed.
It’s like a control panel for your finances—it brings together different metrics and categories in one place so you can quickly assess your financial health and make better decisions.
Why You Need a Financial Dashboard
Most people manage money in fragments: bank apps for checking balances, spreadsheets for budgets, credit card statements for spending, and mental notes for savings goals. This scattered approach makes it hard to get a full picture.
A dashboard solves this by helping you:
- Monitor cash flow and spending habits
- Track debt reduction and savings progress
- Visualize financial goals and milestones
- Identify trends and adjust plans accordingly
- Stay motivated and accountable
Whether you’re just starting out or already managing a complex budget, a dashboard gives you structure and insight that a simple balance check can’t provide.
Step 1: Choose Your Platform
Start by deciding where you’ll build your dashboard. You don’t need expensive tools—simple options like a spreadsheet (Google Sheets or Excel) work perfectly. If you prefer visuals and automation, you can explore dashboard software later, but keep it simple to start.
Benefits of using a spreadsheet:
- It’s free and customizable
- You control the layout and categories
- It’s easy to update and maintain
Step 2: Decide What to Track
Your dashboard should reflect your financial goals and situation. Start with core categories that apply to most people, then add or remove based on your needs.
Core Metrics to Include:
- Monthly income: All sources of income (after taxes)
- Fixed expenses: Rent, utilities, insurance, subscriptions
- Variable expenses: Food, transportation, entertainment
- Savings: Emergency fund, short-term and long-term savings
- Debt: Balances and payments for loans, credit cards
- Net worth: Assets minus liabilities
Optional metrics:
- Investment balances
- Retirement contributions
- Financial goals (e.g., travel, home down payment)
- Spending by category (for insight and optimization)
Step 3: Set Up the Layout
Create a tab or section for each area of your finances. You can keep it as one dashboard or create individual tabs that feed into a summary view. Here’s a simple structure to get started:
- Dashboard tab: A clean summary of all key metrics with totals and charts
- Income tracker: A log of all income sources by date and amount
- Expense tracker: Categories, dates, amounts, and notes
- Savings tracker: Contributions, goals, and progress bars
- Debt tracker: Balances, interest rates, minimums, and payoff goals
- Net worth tab: Total assets minus total debts, updated monthly
Use colors, charts, and conditional formatting to make your dashboard easier to interpret at a glance.
Step 4: Update Regularly
Your dashboard is only useful if you update it consistently. Make it a habit to review and update your dashboard:
- Weekly: Log transactions and review spending
- Monthly: Reconcile totals, calculate savings, update debt balances
- Quarterly: Assess progress toward goals, adjust categories or budgets
Pick a day—like Sunday evening or the first of each month—and block 15–30 minutes for dashboard maintenance. Over time, this process will become second nature.
Step 5: Set Financial Goals and Visualize Them
One of the most motivating features of a dashboard is seeing your goals in progress. Use visual tools like progress bars, charts, or timelines to track savings and debt payoff.
For example:
- Emergency fund: $3,000 of $5,000 saved (60%)
- Credit card payoff: $1,200 remaining of $2,500 balance
- Vacation fund: $800 saved out of $1,500 goal
Visualization helps keep you focused, shows how far you’ve come, and builds momentum to keep going.
Step 6: Customize Based on Your Needs
As you grow more comfortable with your dashboard, personalize it to reflect your unique financial life. You might add:
- Year-to-date totals and trends
- Spending breakdowns by category or by person (if budgeting as a couple)
- Charts comparing this month’s budget to last month’s
- Goal deadlines and reminders
The key is to keep it useful—not overly complex. If something feels cluttered or confusing, simplify it.
Final Thoughts: Turn Awareness into Action
A financial dashboard isn’t just about tracking—it’s about clarity and control. When you can see everything clearly in one place, you’re more empowered to make informed choices, stay on track, and reach your financial goals faster.
Start simple. Focus on consistency over perfection. Your dashboard will evolve as your finances do—and with it, your confidence and peace of mind will grow too.
